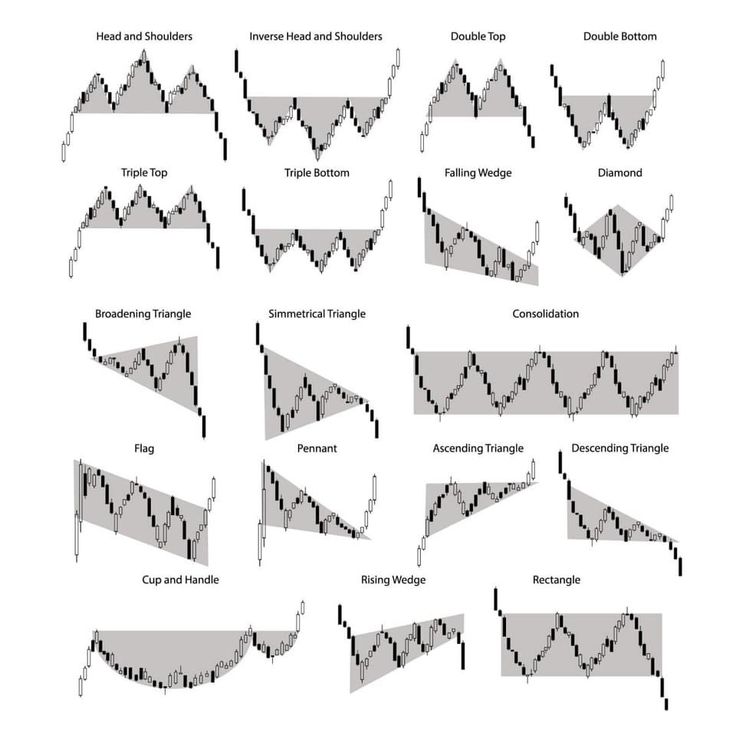
Chart patterns are the cornerstone of technical analysis in trading. They provide a visual representation of market sentiment, helping traders predict potential price movements based on historical data. Understanding chart patterns is essential for traders aiming to enhance their decision-making and maximize profitability. This comprehensive guide will explore the types of chart patterns, their significance, and how to apply them effectively.
What Are Chart Patterns?
Chart patterns are formations on price charts that signal potential future price movements. They occur due to repeated market behavior, offering insights into trends, reversals, and continuations. These patterns are vital for traders across forex, stocks, and cryptocurrencies to make informed decisions.
Chart patterns are generally classified into three categories:
Continuation Patterns – Indicate that the current trend is likely to continue.
Reversal Patterns – Signal a change in the existing trend direction.
Bilateral Patterns – Highlight potential movement in either direction.
Why Are Chart Patterns Important?
Chart patterns offer several advantages to traders:
Improved Decision-Making: By interpreting patterns, traders can better anticipate price movements.
Risk Management: Understanding patterns aids in setting precise stop-loss levels.
Enhanced Confidence: Familiarity with chart patterns builds trader confidence by providing a logical basis for trades.
Key Chart Patterns Every Trader Should Know
Continuation Patterns
These patterns suggest that the existing trend will persist.
a. Flags and Pennants
- Flags: Rectangular patterns that slope against the trend.
- Pennants: Small symmetrical triangles that form after a strong price movement.
Example Usage: If a bullish flag forms during an uptrend, it indicates that the price is likely to continue upward once the consolidation phase ends.
Triangles
- Ascending Triangle: Bullish pattern with a flat top and rising bottom.
- Descending Triangle: Bearish pattern with a flat bottom and falling top.
- Symmetrical Triangle: Indicates price breakout in either direction.
Reversal Patterns
Reversal patterns signal the end of a trend and the beginning of a new one.
Head and Shoulders
- Regular Head and Shoulders: A bearish reversal pattern with three peaks, the middle one being the highest.
- Inverse Head and Shoulders: A bullish reversal pattern with three troughs, the middle one being the lowest.
Pro Tip: The neckline in this pattern acts as the confirmation level for entry points.
Double Tops and Double Bottoms
- Double Top: Bearish pattern where the price peaks twice before declining.
- Double Bottom: Bullish pattern where the price bottoms twice before rising.
Usage Tip: These patterns often indicate significant market reversals, making them highly reliable.
Bilateral Patterns
Bilateral patterns showcase indecision in the market and can lead to price movement in either direction.
Symmetrical Triangles
As mentioned earlier, symmetrical triangles fall under both continuation and bilateral patterns depending on the breakout direction.
Rectangle Patterns
Rectangles form when the price oscillates between parallel support and resistance levels. A breakout above or below the rectangle determines the new direction.
How to Trade Using Chart Patterns
Identify the Pattern
Analyze the price chart carefully to recognize potential patterns. This requires understanding the nuances of each type.
Confirm the Breakout
Before entering a trade, wait for a confirmed breakout beyond key support or resistance levels. Fake breakouts are common, so exercise caution.
Set Entry and Exit Points
- Entry: After the breakout confirmation, enter the trade in the direction of the trend.
- Stop-Loss: Place a stop-loss just below the pattern for long positions or above for short positions.
- Take Profit: Use the pattern’s height to determine target levels (e.g., the height of a flag or head-and-shoulders pattern).
Monitor Volume
Volume is critical for confirming breakouts. A breakout accompanied by high trading volume is more reliable.
Common Mistakes When Trading Chart Patterns
Overlooking Volume
Ignoring volume during breakouts can lead to false signals. Always verify breakout strength with volume analysis.
Rushing into Trades
Entering a trade before the pattern fully forms or the breakout confirms often leads to losses. Patience is key.
Neglecting Risk Management
Failing to set appropriate stop-loss levels can result in significant losses. Proper risk management is essential.
Best Tools for Identifying Chart Patterns
Several platforms and tools can assist in recognizing chart patterns:
TradingView: Offers advanced charting tools and a community for sharing ideas.
MetaTrader 4/5: Popular among forex traders for its charting capabilities.
Pattern Recognition Software: Some platforms have built-in pattern recognition to automate the process.
Conclusion
Chart patterns are indispensable tools for traders. By understanding and applying them correctly, you can significantly improve your trading outcomes. While they are not foolproof, combining pattern analysis with other technical indicators, risk management, and patience will enhance your trading strategy.
Remember, consistent practice and learning are key to mastering chart patterns. With time, you’ll develop the intuition and expertise to navigate markets confidently.
